FxMath Daily Trader EA Package
Pairs: EURUSD, EURJPY, GBPUSD, USDCAD, USDJPY
TimeFrame: Daily(D1)
Trading Strategy: Trend/Swing
Indicators: RSI, CCI, Momentum
EA features:
-
Matatrader 4 Platform
-
User Manual
-
Friendly EA Setting
-
Money Management Function
-
Works with all build +600
SetUp Recommendation:
Please run all 5 EAs in same time in your trading account. For each 500$ deposit set 0.01 lot per each pair.
[wpdm_file id=9 title=”true” desc=”true” template=”facebook ” ]
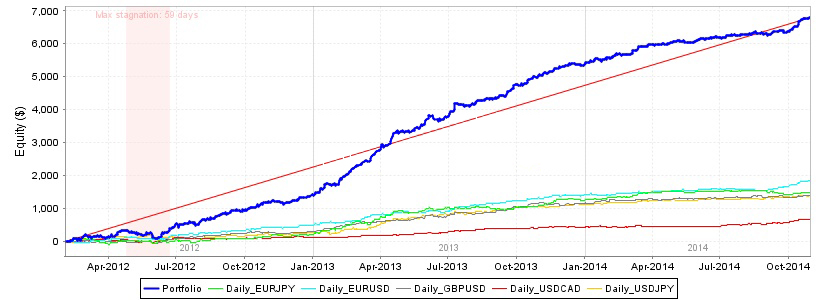
EA Analyzer Portfolio Report
Portfolio
Total Profit $ 6787.01
Profit in pips 36144.41 pips
Yearly Avg profit $ 2545.13
# of trades 2228
Sharpe ratio 0.19
Profit factor 1.8
Return / DD ratio 24.49
Winning % 62.39 %
Drawdown $ 277.14
% Drawdown 5.27 %
Daily Avg profit $ 6.79
Monthly Avg profit $ 212.09
Average trade $ 10.69
Strategies in portfolio
| # | Name | Symbol | Timeframe | Net Profit ($) | Net Profit (pips) | # of Trades | Sharpe Ratio | Profit Factor |
| S1 | Daily_EURJPY | EURJPY | D1 | $ 1486.61 | 8713.31 pips | 478 | 0.16 | 1.65 |
| S2 | Daily_EURUSD | EURUSD | D1 | $ 1845.37 | 9414.3 pips | 461 | 0.25 | 2.21 |
| S3 | Daily_GBPUSD | GBPUSD | D1 | $ 1409.89 | 7401.99 pips | 406 | 0.21 | 1.8 |
| S4 | Daily_USDCAD | USDCAD | D1 | $ 663.42 | 3780.99 pips | 428 | 0.16 | 1.57 |
| S5 | Daily_USDJPY | USDJPY | D1 | $ 1381.72 | 6833.81 pips | 455 | 0.2 | 1.77 |
| # | Name | Return / DD Ratio | Winning % | Drawdown | % Drawdown | Yearly avg. profit | Monthly avg. profit | Daily avg. profit |
| S2 | Daily_EURUSD | 20 | 66.16 % | $ 92.27 | 8.26 % | $ 692.01 | $ 57.67 | $ 1.85 |
| S4 | Daily_USDCAD | 6.44 | 60.75 % | $ 102.98 | 9.96 % | $ 248.78 | $ 20.73 | $ 0.67 |
Monthly Performance ($)
| Year | Jan | Feb | Mar | Apr | May | Jun | Jul | Aug | Sep | Oct | Nov | Dec | YTD |
| 2014 | 198.88 | 105.25 | 290.56 | 113.75 | 4.18 | 96.29 | 99.12 | 40.24 | 48.57 | 419.11 | 0 | 0 | 1415.95 |
| 2013 | 306.01 | 587.32 | 444.12 | 587.09 | 315.09 | 128.72 | 317.41 | 237.65 | 407.96 | 296.81 | 232.09 | 84.82 | 3945.09 |
| 2012 | 0 | 226.87 | -111.79 | 168.37 | -155.71 | 398.34 | -1.26 | 325.7 | 98.94 | 236.64 | -9.94 | 249.81 | 1425.97 |
Stats
Strategy
| Wins/Losses Ratio | 1.66 | Payout Ratio (Avg Win/Loss) | 1.08 | Average # of Bars in Trade | 0 |
| AHPR | 0.04 | Z-Score | 1.48 | Z-Probability | 6.88 % |
| Expectancy | 3.05 | Deviation | $ 16.41 | Exposure | 0 % |
| Stagnation in Days | 59 | Stagnation in % | 5.9 % |
Trades
| # of Wins | 1390 | # of Losses | 838 | ||||
| Gross Profit | $ 15305.6 | Gross Loss | $ -8518.59 | Average Win | $ 11.01 | Average Loss | $ -10.17 |
| Largest Win | $ 85.05 | Largest Loss | $ -55.45 | Max Consec Wins | 19 | Max Consec Losses | 9 |
| Avg Consec Wins | 2.57 | Avg Consec Loss | 1.55 | Avg # of Bars in Wins | 0 | Avg # of Bars in Losses | 0 |
Charts
Click on the chart to see bigger image
 P/L by hour P/L by hour |
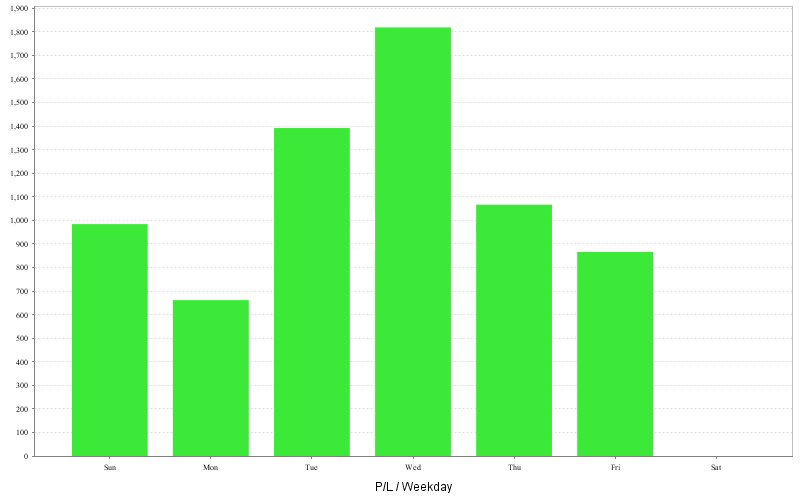 P/L by weekday P/L by weekday |
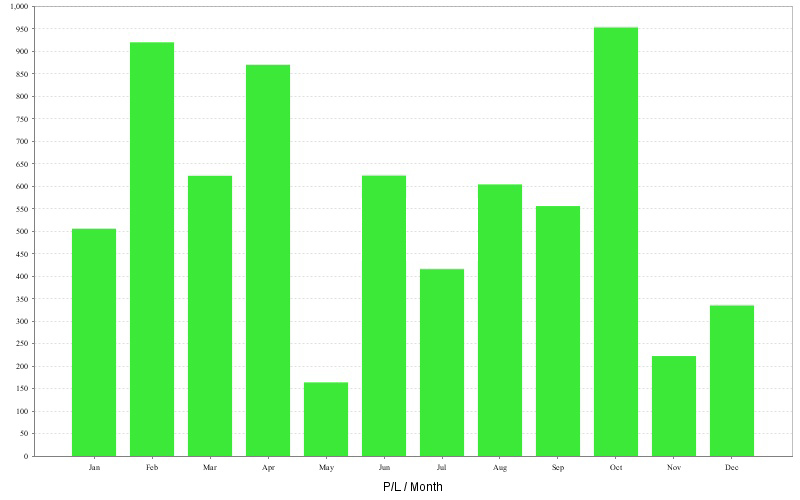 P/L by month P/L by month |
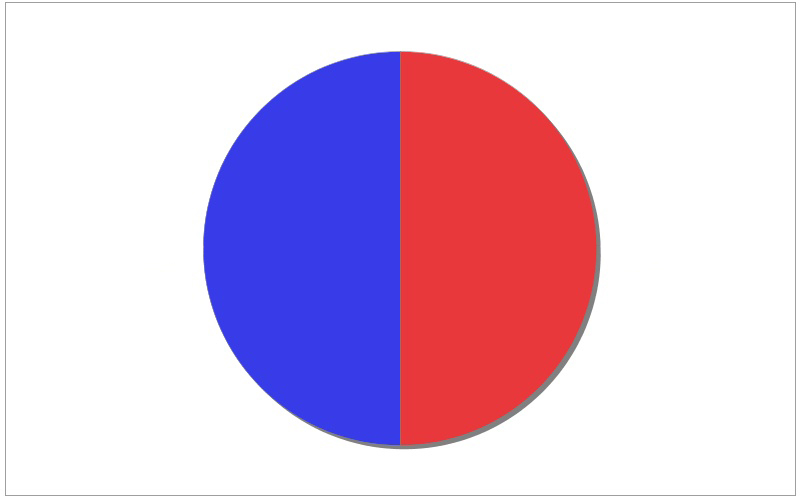 Long vs Short trades Long vs Short trades |
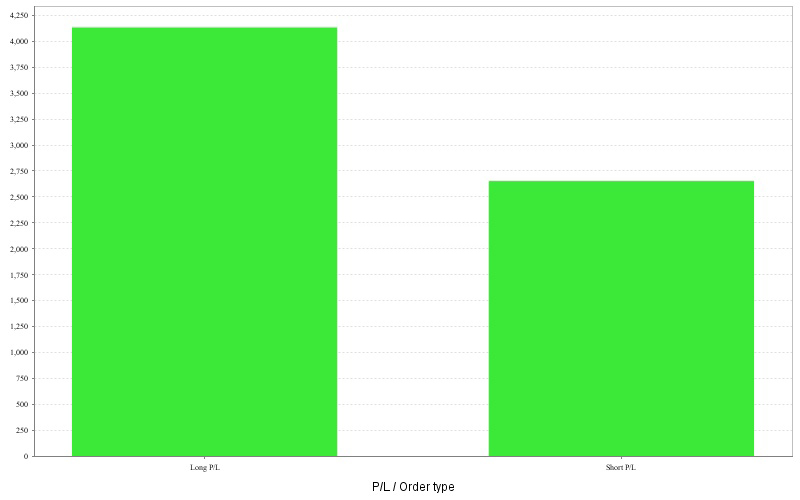 Long vs Short P/L Long vs Short P/L |
 Trades by month Trades by month |
 P/L by trade duration P/L by trade duration |
 Wins/Losses by hour Wins/Losses by hour |
 Wins/Losses Profit by weekday Wins/Losses Profit by weekday |
[wpdm_all_packages]
