FxMath Hedge Fund Trader 1
Pairs: EURUSD, GBPUSD, EURJPY, USDCAD, USDCHF, USDJPY
TimeFrame: H1
Trading Strategy: Trend/Swing, Price Action
Return/DD Ratio: 30.64
Small Drawn Down: 10.79 %
Profit Factor: 1.74
Deviation” $76.02
Wins/Losses Ratio: 1.28
EA features:
-
EA Auto Installer
-
Matatrader 4 Platform
-
User Manual
-
Friendly EA Setting
-
Money Management Function
-
Works with all build +600
-
Life time update
-
Free setting for other pairs
What is Hedge Fund?
At its most basic, a hedge fund is an investment vehicle that pools capital from a number of investors and invests in securities and other instruments.It is administered by a professional management firm, and often structured as a limited partnership, limited liability company, or similar vehicle. Hedge funds are generally distinct from mutual funds as their use of leverage is not capped by regulators and from private equity funds as the majority of hedge funds invest in relatively liquid assets. Hedge funds invest in a diverse range of markets and use a wide variety of investment styles and financial instruments. The name “hedge fund” refers to the hedging techniques traditionally used by hedge funds, but hedge funds today do not necessarily hedge.Hedge funds are made available only to certain sophisticated or accredited investors and cannot be offered or sold to the general public. As such, they generally avoid direct regulatory oversight, bypass licensing requirements applicable to investment companies, and operate with greater flexibility than mutual funds and other investment funds.Hedge funds have existed for many decades, but have become increasingly popular in recent years, growing to be one of the world’s major investment vehicles and sources of capital.
Hedge funds are most often open-ended and allow additions or withdrawals by their investors (generally on a monthly or quarterly basis).A hedge fund’s value is calculated as a share of the fund’s net asset value, meaning that increases and decreases in the value of the fund’s investment assets (and fund expenses) are directly reflected in the amount an investor can later withdraw.
Many hedge fund investment strategies aim to achieve a positive return on investment regardless of whether markets are rising or falling (“absolute return”). Hedge fund managers often invest money of their own in the fund they manage, which serves to align their own interests with those of the investors in the fund.A hedge fund typically pays its investment manager an annual management fee (for example 1 percent of the assets of the fund), and a performance fee (for example 20% of the increase in the fund’s net asset value during the year).Some hedge funds have several billion dollars of assets under management (AUM). As of 2009, hedge funds represented 1.1% of the total funds and assets held by financial institutions.As of June 2013, the estimated size of the global hedge fund industry was US$2.4 trillion.
Because hedge funds are not sold to the general public or retail investors, the funds and their managers have historically been exempt from some of the regulation that governs other funds and investment managers with regard to how the fund may be structured and how strategies and techniques are employed. Regulations passed in the United States and Europe after the Financial crisis of 2007–08 were intended to increase government oversight of hedge funds and eliminate certain regulatory gaps.
What is FxMath Hedge Fund Trader 1?
FxMath Hedge Fund Trader 1 is package of four our Expert Advisors. EAs are using different strategies same Price Action, Swing and Trend. This package is include below EAs:
-
FXMATH_H1_EU_1 EXPERT ADVISOR
-
FXMATH_H1_EU_2 EXPERT ADVISOR
-
FXMATH_H1_GU_1 EXPERT ADVISOR
-
FXMATH_H1_EJ_1 EXPERT ADVISOR
EAs designed for EURUSD, GBPUSD, EURJPY for this time. we will increase number of pairs in new future too.
Advantage using several strategies in one account:
-
Control drawn down and reduce that
-
Making continuous profit
-
Safe trading due using different pairs
-
Safe trading due using different strategies
-
Control account free margin
-
Smaller standard division of profit
Price: 291 USD
EA Analyzer Portfolio Report
EA Analyzer Portfolio Report
Portfolio
Total Profit $ 17855.38
Profit in pips 18627.54 pips
Yearly Avg profit $ 6492.87
# of trades 1279
Sharpe ratio 0.18
Profit factor 1.74
Return / DD ratio 30.64
Winning % 56.06 %
Drawdown $ 582.73
% Drawdown 10.79 %
Daily Avg profit $ 17.68
Monthly Avg profit $ 541.07
Average trade $ 51.49
Strategies in portfolio
#
Name
Symbol
Timeframe
Net Profit ($)
Net Profit (pips)
# of Trades
Sharpe Ratio
Profit Factor
S1
RezaFx_H1_EJ_Backtest
EURJPY
H1
$ 5850.15
6410.47 pips
345
0.18
1.73
S2
RezaFx_H1_EU_Backtest_1
EURUSD
H1
$ 5310.92
5381.1 pips
280
0.26
2.12
S3
RezaFx_H1_EU_backtest
EURUSD
H1
$ 4412.02
4482.9 pips
357
0.21
1.81
S4
RezaFx_H1_GU_Backtest_1
GBPUSD
H1
$ 2282.3
2353.1 pips
297
0.14
1.4
#
Name
Return / DD Ratio
Winning %
Drawdown
% Drawdown
Yearly avg. profit
Monthly avg. profit
Daily avg. profit
S2
RezaFx_H1_EU_Backtest_1
16.49
63.93 %
$ 322.16
13.15 %
$ 1931.24
$ 160.94
$ 5.27
S4
RezaFx_H1_GU_Backtest_1
7.64
58.92 %
$ 298.71
25.93 %
$ 829.93
$ 69.16
$ 2.26
Monthly Performance ($)
Year
Jan
Feb
Mar
Apr
May
Jun
Jul
Aug
Sep
Oct
Nov
Dec
YTD
2014
957.76
435.56
212.45
45.53
230.92
327.13
56.86
-150.47
882.26
-143.77
0
0
2854.23
2013
1210.16
690.36
1428.24
867.68
550.73
919.77
462.31
658.69
828.17
362.94
537.73
653.62
9170.4
2012
698.55
667.93
87.1
587.49
801.01
1189.31
496.76
-19.11
422.67
705.34
-113.12
306.83
5830.76
Stats
Strategy
Wins/Losses Ratio
1.28
Payout Ratio (Avg Win/Loss)
1.37
Average # of Bars in Trade
0
AHPR
0.14
Z-Score
0.59
Z-Probability
27.76 %
Expectancy
13.96
Deviation
$ 76.02
Exposure
0 %
Stagnation in Days
90
Stagnation in %
8.91 %
Trades
# of Wins
717
# of Losses
562
Gross Profit
$ 41856.54
Gross Loss
$ -24001.17
Average Win
$ 58.38
Average Loss
$ -42.71
Largest Win
$ 267.53
Largest Loss
$ -203.09
Max Consec Wins
11
Max Consec Losses
7
Avg Consec Wins
2.23
Avg Consec Loss
1.75
Avg # of Bars in Wins
0
Avg # of Bars in Losses
0
Charts
Click on the chart to see bigger image
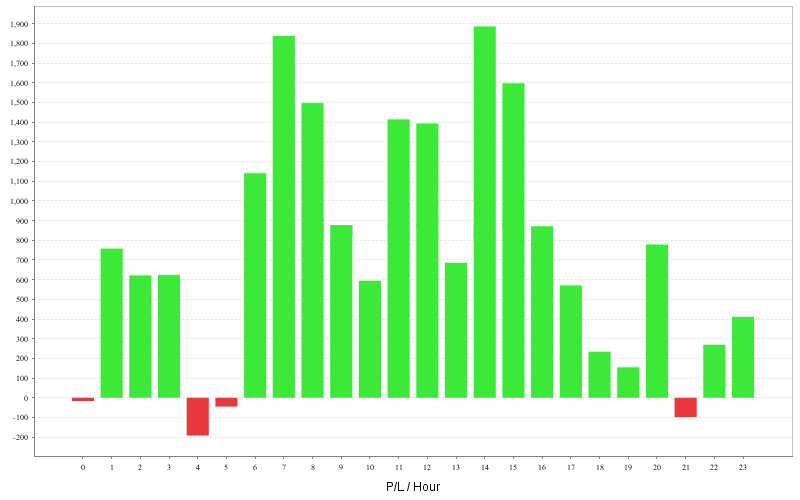 P/L by hour
 P/L by weekday
 P/L by month
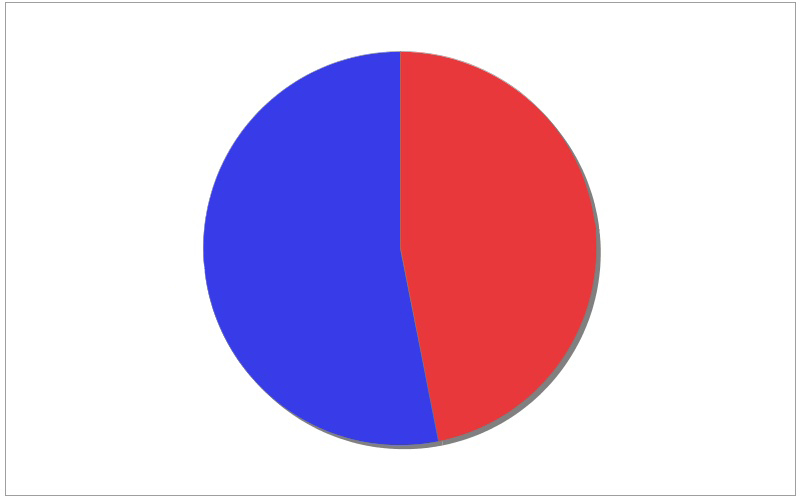 Long vs Short trades
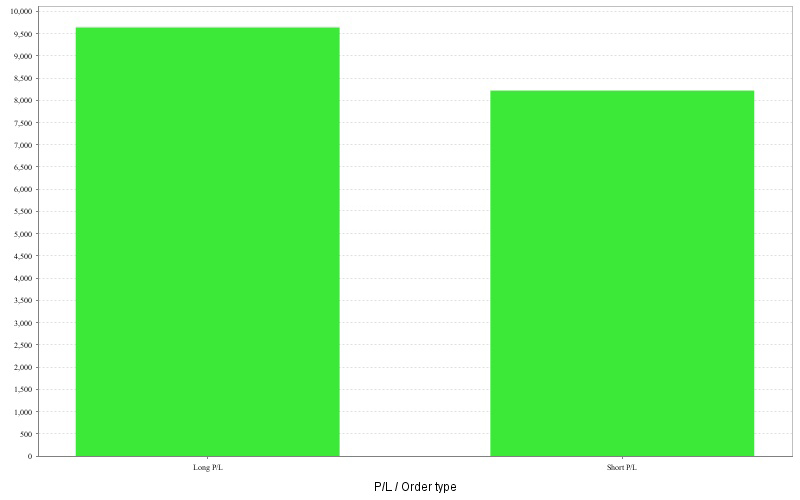 Long vs Short P/L
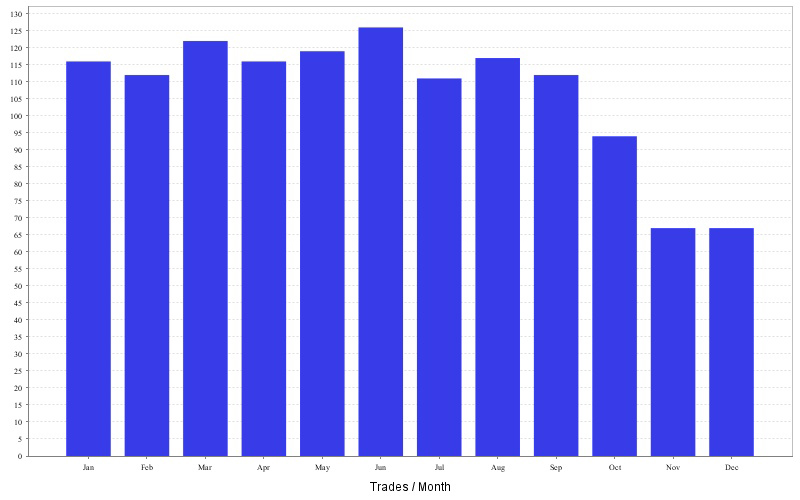 Trades by month
 P/L by trade duration
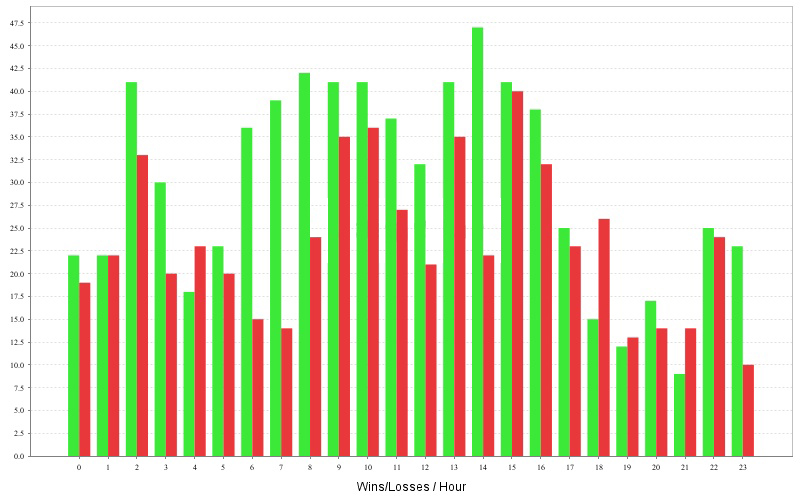 Wins/Losses by hour
 Wins/Losses Profit by weekday
EA Analyzer Portfolio Report
Portfolio
Total Profit $ 17855.38
Profit in pips 18627.54 pips
Yearly Avg profit $ 6492.87
# of trades 1279
Sharpe ratio 0.18
Profit factor 1.74
Return / DD ratio 30.64
Winning % 56.06 %
Drawdown $ 582.73
% Drawdown 10.79 %
Daily Avg profit $ 17.68
Monthly Avg profit $ 541.07
Average trade $ 51.49
Strategies in portfolio
| # | Name | Symbol | Timeframe | Net Profit ($) | Net Profit (pips) | # of Trades | Sharpe Ratio | Profit Factor |
| S1 | RezaFx_H1_EJ_Backtest | EURJPY | H1 | $ 5850.15 | 6410.47 pips | 345 | 0.18 | 1.73 |
| S2 | RezaFx_H1_EU_Backtest_1 | EURUSD | H1 | $ 5310.92 | 5381.1 pips | 280 | 0.26 | 2.12 |
| S3 | RezaFx_H1_EU_backtest | EURUSD | H1 | $ 4412.02 | 4482.9 pips | 357 | 0.21 | 1.81 |
| S4 | RezaFx_H1_GU_Backtest_1 | GBPUSD | H1 | $ 2282.3 | 2353.1 pips | 297 | 0.14 | 1.4 |
| # | Name | Return / DD Ratio | Winning % | Drawdown | % Drawdown | Yearly avg. profit | Monthly avg. profit | Daily avg. profit |
| S2 | RezaFx_H1_EU_Backtest_1 | 16.49 | 63.93 % | $ 322.16 | 13.15 % | $ 1931.24 | $ 160.94 | $ 5.27 |
| S4 | RezaFx_H1_GU_Backtest_1 | 7.64 | 58.92 % | $ 298.71 | 25.93 % | $ 829.93 | $ 69.16 | $ 2.26 |
Monthly Performance ($)
| Year | Jan | Feb | Mar | Apr | May | Jun | Jul | Aug | Sep | Oct | Nov | Dec | YTD |
| 2014 | 957.76 | 435.56 | 212.45 | 45.53 | 230.92 | 327.13 | 56.86 | -150.47 | 882.26 | -143.77 | 0 | 0 | 2854.23 |
| 2013 | 1210.16 | 690.36 | 1428.24 | 867.68 | 550.73 | 919.77 | 462.31 | 658.69 | 828.17 | 362.94 | 537.73 | 653.62 | 9170.4 |
| 2012 | 698.55 | 667.93 | 87.1 | 587.49 | 801.01 | 1189.31 | 496.76 | -19.11 | 422.67 | 705.34 | -113.12 | 306.83 | 5830.76 |
Stats
Strategy
| Wins/Losses Ratio | 1.28 | Payout Ratio (Avg Win/Loss) | 1.37 | Average # of Bars in Trade | 0 |
| AHPR | 0.14 | Z-Score | 0.59 | Z-Probability | 27.76 % |
| Expectancy | 13.96 | Deviation | $ 76.02 | Exposure | 0 % |
| Stagnation in Days | 90 | Stagnation in % | 8.91 % |
Trades
| # of Wins | 717 | # of Losses | 562 | ||||
| Gross Profit | $ 41856.54 | Gross Loss | $ -24001.17 | Average Win | $ 58.38 | Average Loss | $ -42.71 |
| Largest Win | $ 267.53 | Largest Loss | $ -203.09 | Max Consec Wins | 11 | Max Consec Losses | 7 |
| Avg Consec Wins | 2.23 | Avg Consec Loss | 1.75 | Avg # of Bars in Wins | 0 | Avg # of Bars in Losses | 0 |
Charts
Click on the chart to see bigger image
 P/L by hour P/L by hour |
 P/L by weekday P/L by weekday |
 P/L by month P/L by month |
 Long vs Short trades Long vs Short trades |
 Long vs Short P/L Long vs Short P/L |
 Trades by month Trades by month |
 P/L by trade duration P/L by trade duration |
 Wins/Losses by hour Wins/Losses by hour |
 Wins/Losses Profit by weekday Wins/Losses Profit by weekday |

30 DAY MONEY BACK GUARANTEE
In the event we are unable to accord you product support or we are unable to fix a bug in the software within a reasonable time, you are entitled to our 30-day, no-hassle money-back guarantee. Your account will be credited promptly.
You are also entitled to a 12 Months Performance guarantee. What does this mean? If metaquotes were to do some changes like they did with build 600. You are entitled to a free update within one year from your date of purchase.

