EA Analyzer Portfolio Report
Portfolio
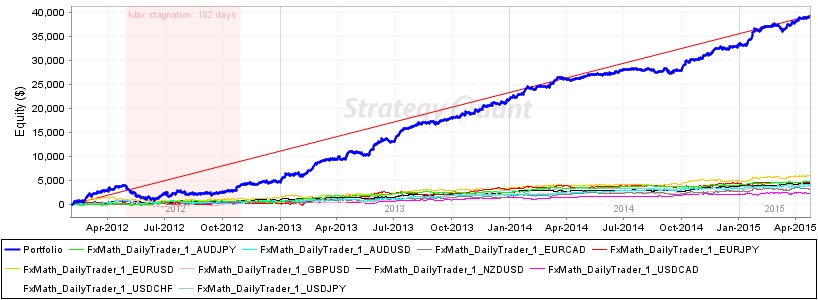
Total Profit $ 39288.91
Profit in pips 42757.71 pips
Yearly Avg profit $ 12407.02
# of trades 6908
Sharpe ratio 0.07
Profit factor 1.29
Return / DD ratio 12.67
Winning % 50.77 %
Drawdown $ 3100.96
% Drawdown 24.82 %
Daily Avg profit $ 33.41
Monthly Avg profit $ 1033.92
Average trade $ 45.08
Strategies in portfolio
| # | Name | Symbol | Timeframe | Net Profit ($) | Net Profit (pips) | # of Trades | Sharpe Ratio | Profit Factor |
| S1 | FxMath_DailyTrader_1_AUDJPY | AUDJPY | D1 | $ 4736.91 | 5755.59 pips | 602 | 0.1 | 1.37 |
| S2 | FxMath_DailyTrader_1_AUDUSD | AUDUSD | D1 | $ 3984.72 | 4168.6 pips | 583 | 0.1 | 1.32 |
| S3 | FxMath_DailyTrader_1_EURCAD | EURCAD | D1 | $ 3180.56 | 4128.55 pips | 712 | 0.08 | 1.23 |
| S4 | FxMath_DailyTrader_1_EURJPY | EURJPY | D1 | $ 4410.59 | 5262.99 pips | 783 | 0.07 | 1.25 |
| S5 | FxMath_DailyTrader_1_EURUSD | EURUSD | D1 | $ 5875.37 | 5934.4 pips | 748 | 0.12 | 1.41 |
| S6 | FxMath_DailyTrader_1_GBPUSD | GBPUSD | D1 | $ 3919.62 | 3970.01 pips | 858 | 0.06 | 1.22 |
| S7 | FxMath_DailyTrader_1_NZDUSD | NZDUSD | D1 | $ 4296.29 | 4353.6 pips | 809 | 0.1 | 1.34 |
| S8 | FxMath_DailyTrader_1_USDCAD | USDCAD | D1 | $ 2241.75 | 2505.09 pips | 430 | 0.1 | 1.27 |
| S9 | FxMath_DailyTrader_1_USDCHF | USDCHF | D1 | $ 2463.65 | 2370.5 pips | 610 | 0.06 | 1.19 |
| S10 | FxMath_DailyTrader_1_USDJPY | USDJPY | D1 | $ 4179.45 | 4308.41 pips | 773 | 0.09 | 1.3 |
| # | Name | Return / DD Ratio | Winning % | Drawdown | % Drawdown | Yearly avg. profit | Monthly avg. profit | Daily avg. profit |
| S2 | FxMath_DailyTrader_1_AUDUSD | 4.27 | 56.09 % | $ 932.4 | 56.61 % | $ 1258.33 | $ 104.86 | $ 3.39 |
| S4 | FxMath_DailyTrader_1_EURJPY | 5.45 | 48.4 % | $ 809.55 | 50.51 % | $ 1512.2 | $ 126.02 | $ 4.05 |
| S6 | FxMath_DailyTrader_1_GBPUSD | 3.45 | 48.37 % | $ 1137.09 | 116.96 % | $ 1237.77 | $ 103.15 | $ 3.33 |
| S8 | FxMath_DailyTrader_1_USDCAD | 4.07 | 52.56 % | $ 551.26 | 41.42 % | $ 707.92 | $ 58.99 | $ 1.91 |
| S10 | FxMath_DailyTrader_1_USDJPY | 10.19 | 45.15 % | $ 410.27 | 30.81 % | $ 1319.83 | $ 109.99 | $ 3.55 |
Monthly Performance ($)
| Year | Jan | Feb | Mar | Apr | May | Jun | Jul | Aug | Sep | Oct | Nov | Dec | YTD |
| 2015 | 2868.83 | 1097.79 | 584.48 | 1479.86 | 0 | 0 | 0 | 0 | 0 | 0 | 0 | 0 | 6030.96 |
| 2014 | 2498.28 | 159.3 | 1809.66 | 439.9 | 429.2 | 938.6 | -145.04 | -232.71 | 261.76 | 2623.45 | 2005.85 | 770.44 | 11558.69 |
| 2013 | 1186.82 | 2640.69 | 760.13 | 1350.93 | 1733.1 | 633.25 | 3192.76 | 920.14 | 874.53 | 673.27 | 1807.68 | 1180.4 | 16953.7 |
| 2012 | 0 | 1715.39 | 1006.51 | 941.93 | -2510.75 | 1013.02 | 346.26 | -247.6 | 200.16 | 1601.51 | 441.05 | 238.09 | 4745.57 |
Stats
Strategy
| Wins/Losses Ratio | 1.03 | Payout Ratio (Avg Win/Loss) | 1.25 | Average # of Bars in Trade | 0 |
| AHPR | 0.02 | Z-Score | -0.55 | Z-Probability | 70.75 % |
| Expectancy | 5.69 | Deviation | $ 72.62 | Exposure | 0 % |
| Stagnation in Days | 182 | Stagnation in % | 15.48 % |
Trades
| # of Wins | 3507 | # of Losses | 3401 | ||||
| Gross Profit | $ 175368.05 | Gross Loss | $ -136079.08 | Average Win | $ 50.01 | Average Loss | $ -40.01 |
| Largest Win | $ 252.12 | Largest Loss | $ -141.75 | Max Consec Wins | 12 | Max Consec Losses | 10 |
| Avg Consec Wins | 2.04 | Avg Consec Loss | 1.98 | Avg # of Bars in Wins | 0 | Avg # of Bars in Losses | 0 |
Charts
Click on the chart to see bigger image
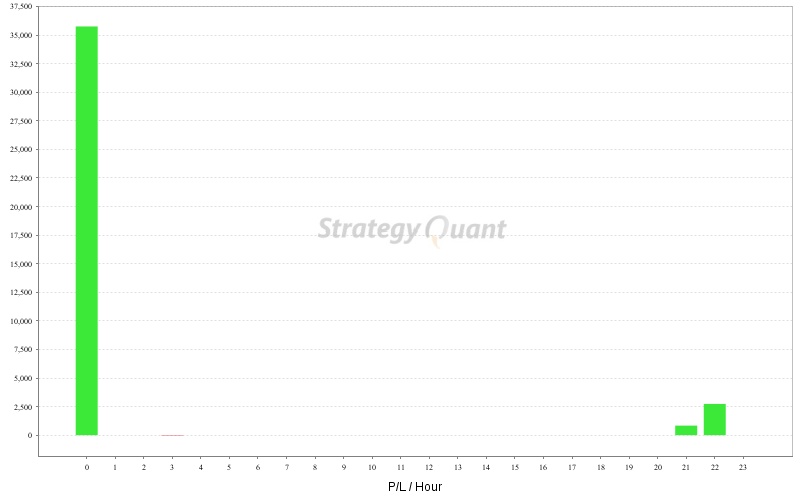 P/L by hour P/L by hour |
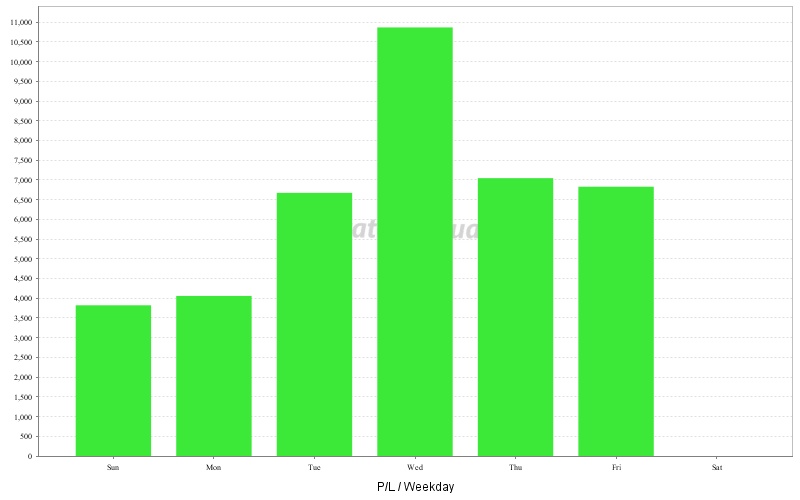 P/L by weekday P/L by weekday |
 P/L by month P/L by month |
 Long vs Short trades Long vs Short trades |
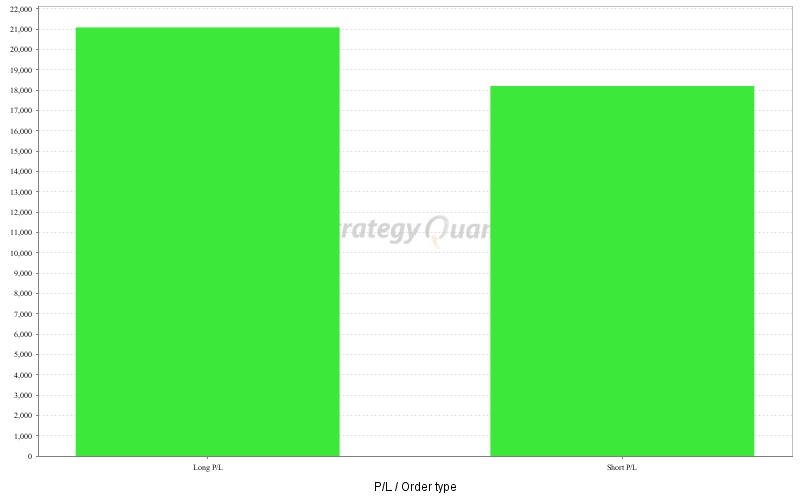 Long vs Short P/L Long vs Short P/L |
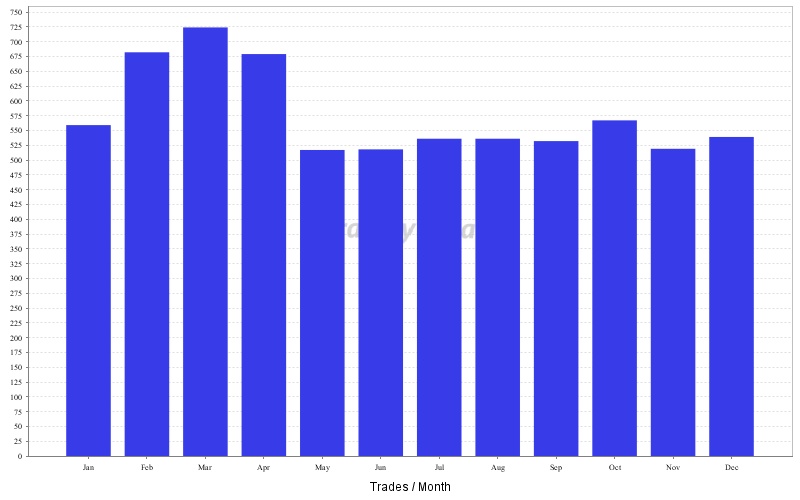 Trades by month Trades by month |
 P/L by trade duration P/L by trade duration |
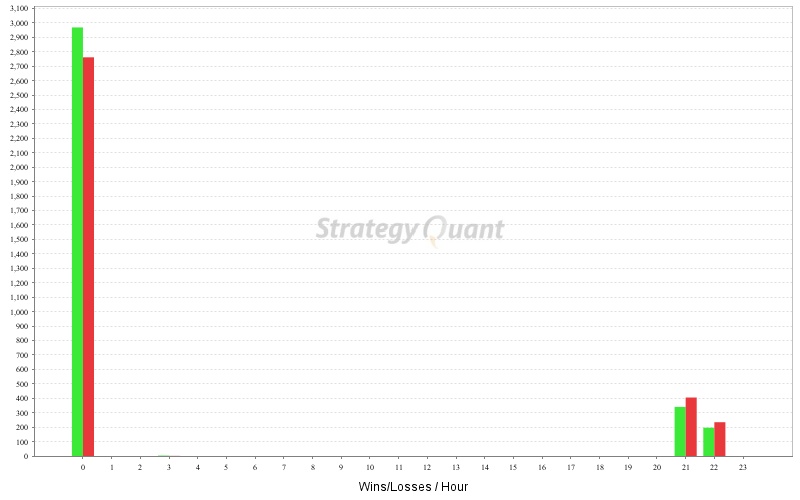 Wins/Losses by hour Wins/Losses by hour |
 Wins/Losses Profit by weekday Wins/Losses Profit by weekday |